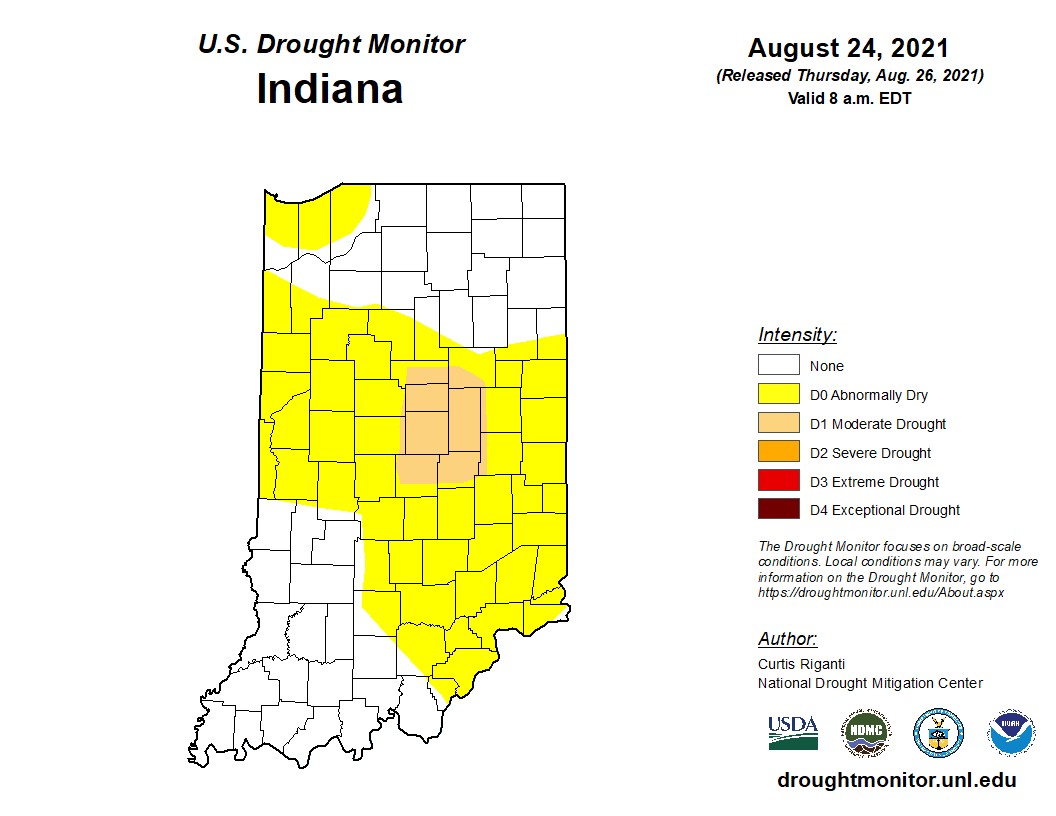
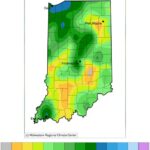
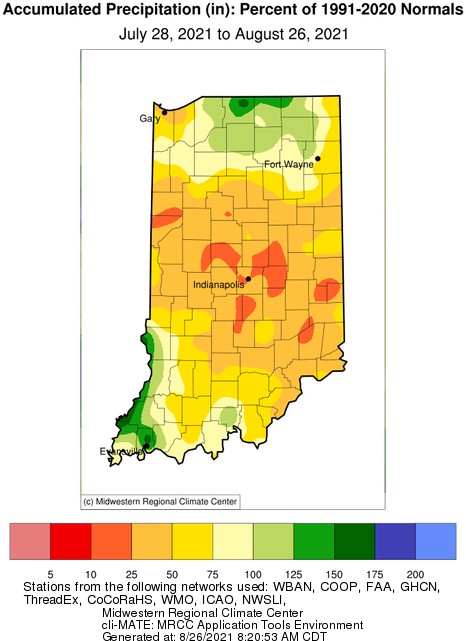
A lack of abundant precipitation over the past month has caused abnormally dry conditions to expand across Indiana this week with several counties in central Indiana intensifying to the Moderate Drought stage of the US Drought Monitor (Figure 1). Some intense weather systems passed through the state this week (Figure 2), however, this was not enough to fully alleviate the deficit that has been building up over the past 30 days. Figure 3 shows the percent of the climatological normal amount of precipitation that was received over the recent 30-day period. Note areas in red that indicate the precipitation received this year for that period was similar to the 10th to 25th percentile of the driest amounts recorded from 1991 through 2020 for that same period of time. In other words, that is very dry. According to the National Oceanic and Atmospheric Administration, east-central Indiana would need three to six inches of rain to bring the Palmer Drought Index back to within normal ranges; most of the rest of Indiana would need up to three inches (https://www.cpc.ncep.noaa.gov/products/analysis_monitoring/regional_monitoring/addpcp.gif).
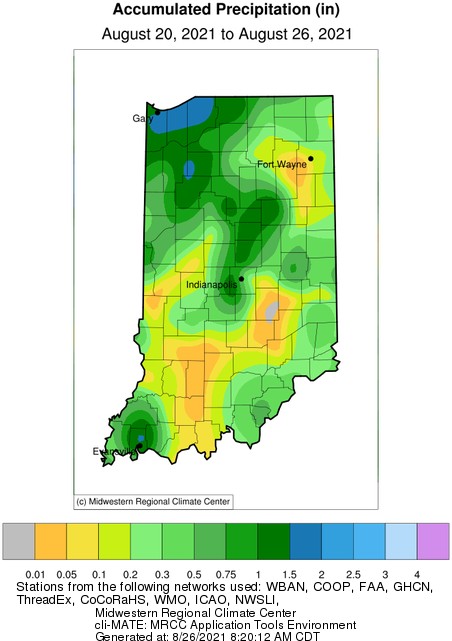
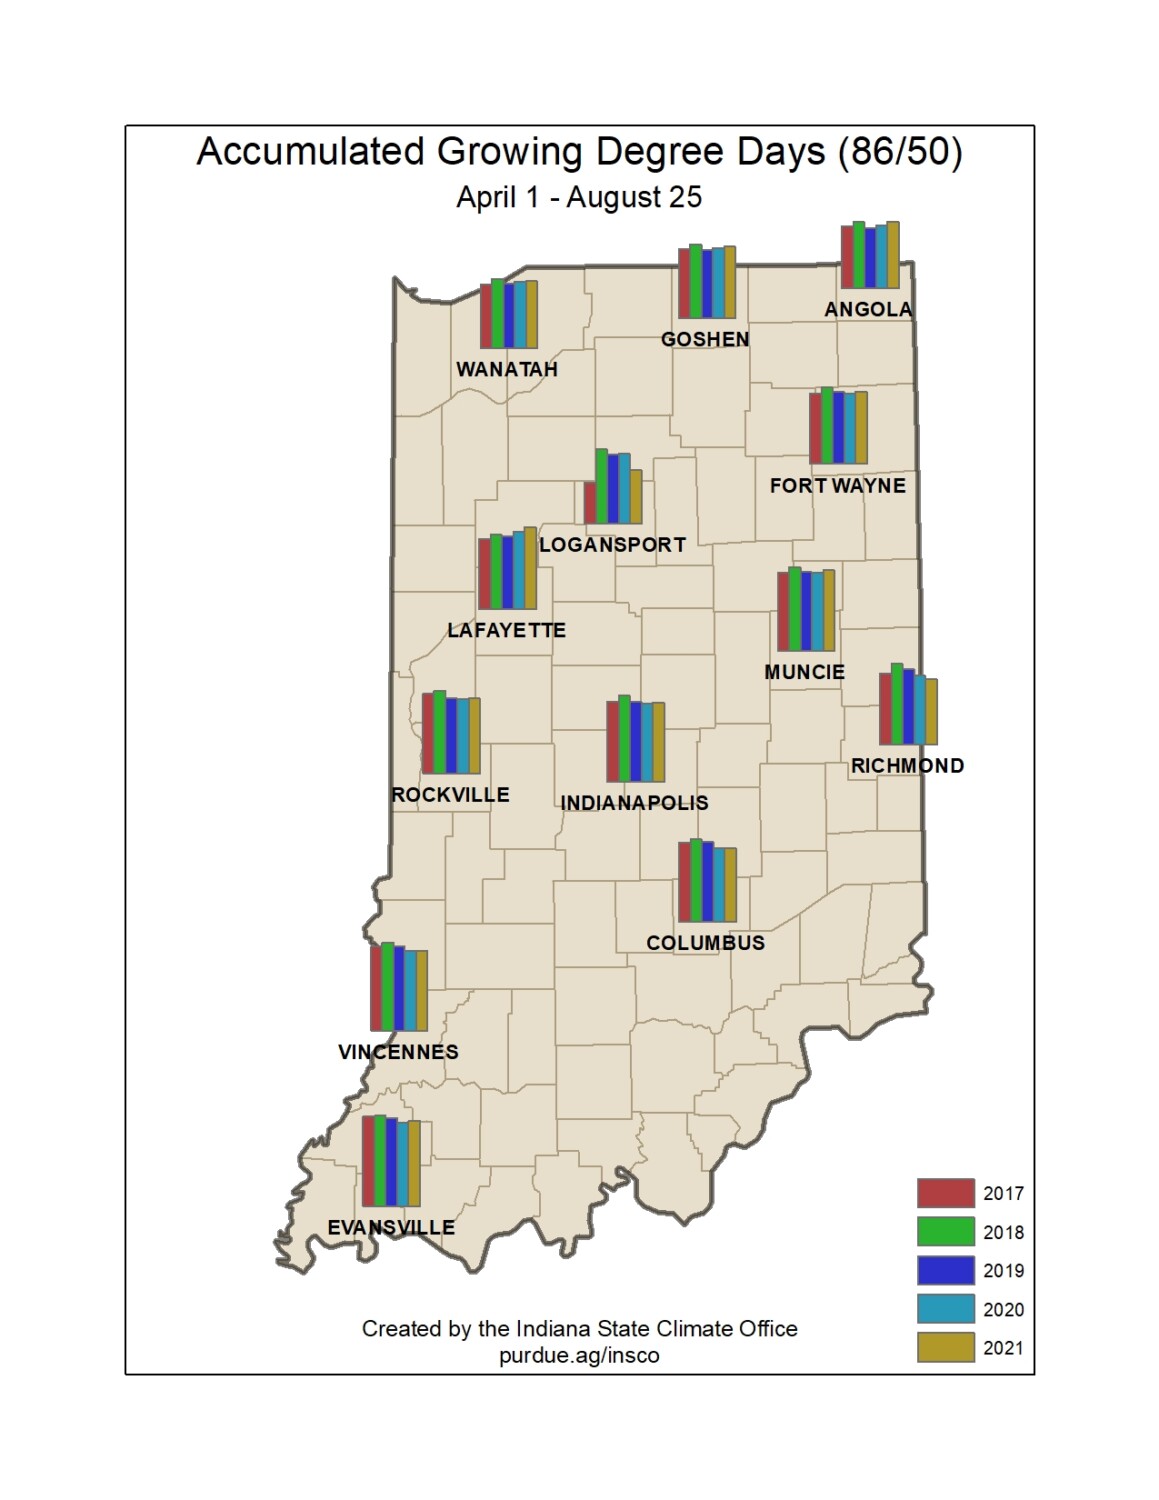
The warm temperatures, along with very high amounts of water vapor (humidity), have made this week uncomfortably muggy. There was hope that this mugginess would be behind us, but weather patterns and high tropical storm activity has kept above-average humidity lingering. Accumulated growing degree days now range from about 2300 units in northern Indiana to a little over 2900 units in southern Indiana (Figure 4). Figures 5 and 6 show how these degree-day accumulations compare to climatology and recent years, respectively.
-
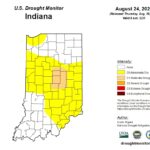
- Figure 1. US Drought Monitor conditions for Indiana as of 24 August 2021.
-
- Figure 2. Accumulated precipitation amounts (inches) from reported from August 20-26, 2021
-
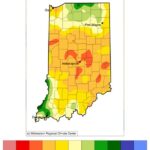
- Figure 3. Precipitation from July 28, 2021 through August 26, 2021 presented as the percentage of the 1991-2020 climatological normal period.
-
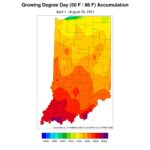
- Figure 4. Accumulated modified growing degree days for April 1 through August 25, 2021.

-
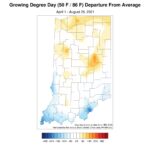
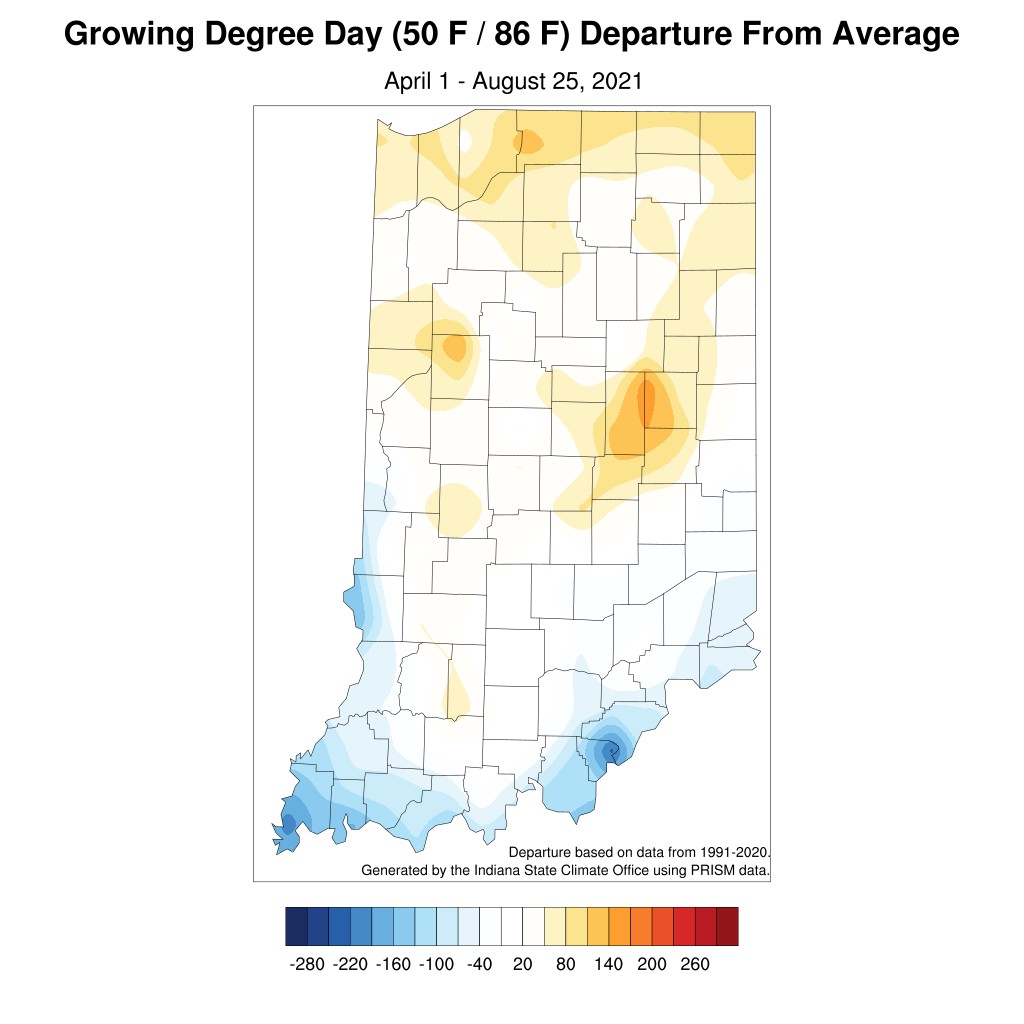
- Figure 5. Accumulated modified growing degree day departure from the 1991-2020 climatological average for April 1 through August 25, 2021.
-
- Figure 6. Comparison of 2021 modified growing degree day accumulations from April 1 – August 25 to the past four years.