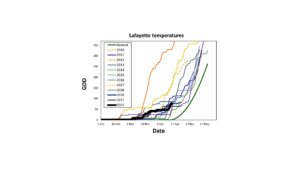
One way we measure how this year’s weather compares with previous years is by looking at the accumulation of “Growing Degree Days” (GDD). This allows us to see if we’re running ahead or behind previous years at the same date. In this graph showing temperatures over the last 12 years in Lafayette, we can see a number of things happening:
- Every year of the past 12 years has been earlier than the long term average – maybe listing this as “normal” is not appropriate anymore!
- This year we’re about the middle of the pack of the last 12 years. Not particularly early and not particularly late
- Many people remember how early the 2012 season was and how we suffered significant freeze damage. 2012 stands out on the graph as an extremely early year
- Warm temperatures are forecast for later this week (80°F predicted for Lafayette), which will change the graph considerably. As flowers are opening we’re hoping this will be good weather for pollinators.
