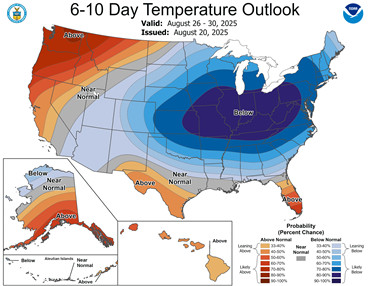
With brute and sudden force, the atmosphere is doing its job: acting like a fluid. Weather is not a precise science, which means the atmosphere is constantly shifting. There tends to be some sort of pattern shift come mid-late August, and it looks like it’s just about here. Temperatures are on their way down, as the National Weather Service’s Climate Prediction Center (CPC) predicts a nearly 100% chance of sustained below-normal temperatures 6-10 days out from writing, so August 26-30 (Figure 1). We’re talking lows in the upper 40s in certain spots across northern Indiana—brr! Cities like Fort Wayne, Lafayette, South Bend, and Valparaiso could be seeing these temperatures. The last time minimum temperatures dropped below 50°F in Lafayette and South Bend was on June 2.
This is all welcome news for anyone who has worked outdoors and has not enjoyed what has been an incredibly humid summer. The Lafayette area has had the second-highest number of dew points greater than 70°F this summer. For reference, dew points of 65°F-70°F are generally considered humid, while dew points above 70°F are very humid. Dew points can also reach above 75°F, as they have on several occasions this summer, and that is considered oppressive humidity. We’re going to see some very low dew points through the end of the month, but that doesn’t mean the humidity has left for good. Some models indicate a major warm-up again around Labor Day Weekend—another example of the atmosphere acting as a fluid, with all of its highs and lows.
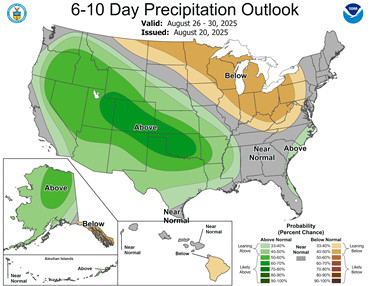
Even with all the dramatic swings in temperatures and humidity, we will at the very least have sunshine. In fact, maybe too much sunshine, as below-normal precipitation is also quite likely in the 6–10-day outlook (Figure 2). We tend to get a bit drier in Indiana in August and September, but this period is expected to be drier than normal, which means anyone with stakes in agriculture may want to monitor soil moisture closely.
-
- Figure 1: The CPC indicates a nearly 100% chance of below normal temperatures over much of the Midwest.
-
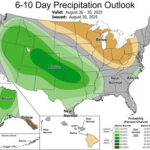
- Figure 2: The CPC indicates a likely chance of below normal precipitation across the Midwest.