The month of May in Indiana was 2°F-4°F below normal across the state, based upon the new 1991-2020 climatological normals that were released last month. Climatological normals are roughly the 30-year average of weather variables and are updated every 10 years. Prior to the new normals being released, climatologists were using the 1981-2010 period for the climatological normals. However, since data from 1981-1990 were dropped and 2011-2020 were added, this modified the new climatological normals to account for climate change trends such as warmer temperature and either wetter or drier precipitation values depending upon the time of year. Therefore, the fact that May 2021 ended up being cooler than normal was likely due more to the use of the updated climatological normals being warmer than any other remarkable cause.
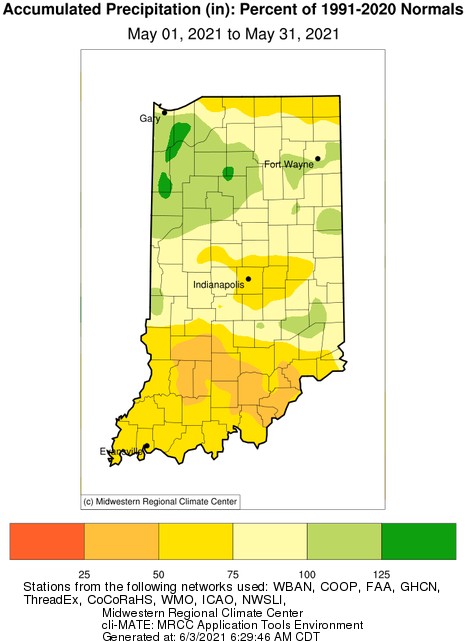
May’s precipitation totals across the state was near normal throughout most of the central and northern counties. However, the southern third of Indiana was much drier with monthly totals falling within the 25th to 75th percentile of normal (Figure 1). This has led to the development and expansion of abnormally dry conditions in various counties in the south and the gradual elimination of abnormally dry conditions in the north (Figure 2). The climate outlooks for both June and the June-July-August periods are only slightly favoring above-normal precipitation, so forecasters and climatologists are keeping an eye on conditions to closely track whether or not drought develops further across the state or gets eliminated. At this time, there is not serious concern of an intense drought occurring such as what was experienced in 2012, but with increased temperatures and the potentially longer periods of dryness between rainfall events, water stress could occur. This will raise concern for those areas dependent upon groundwater, particularly where irrigation is occurring and groundwater supplies haven’t fully replenished over the winter and early spring.
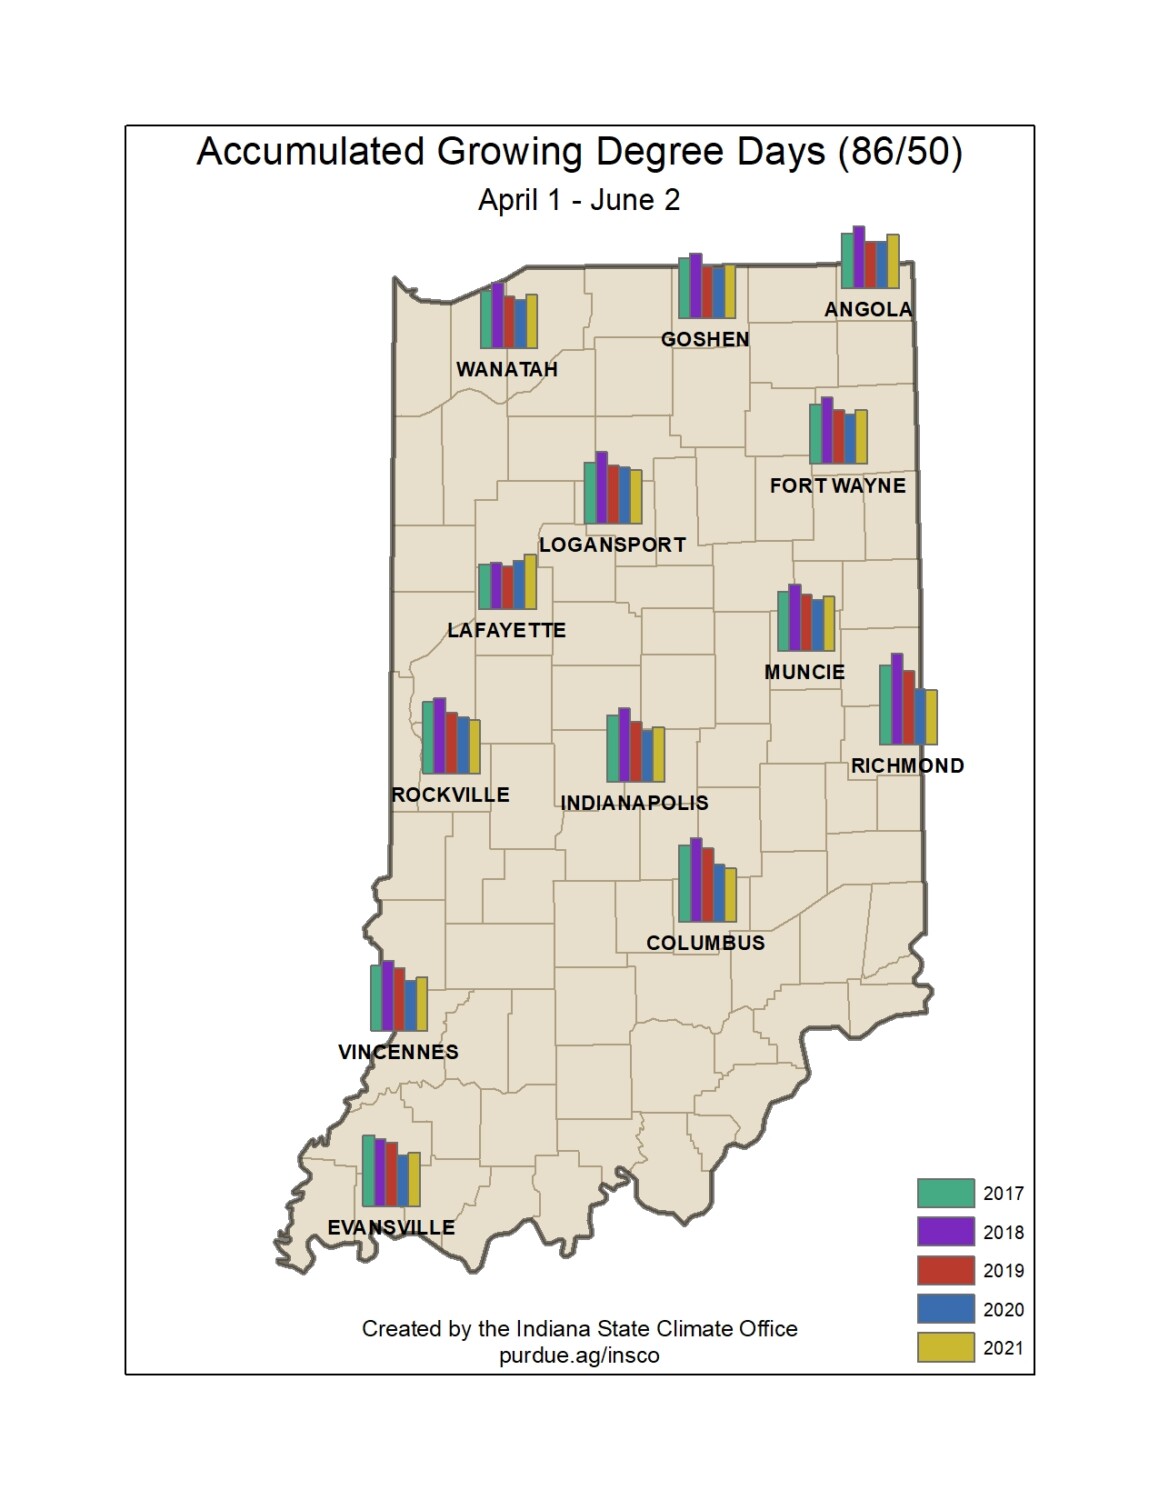
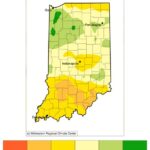
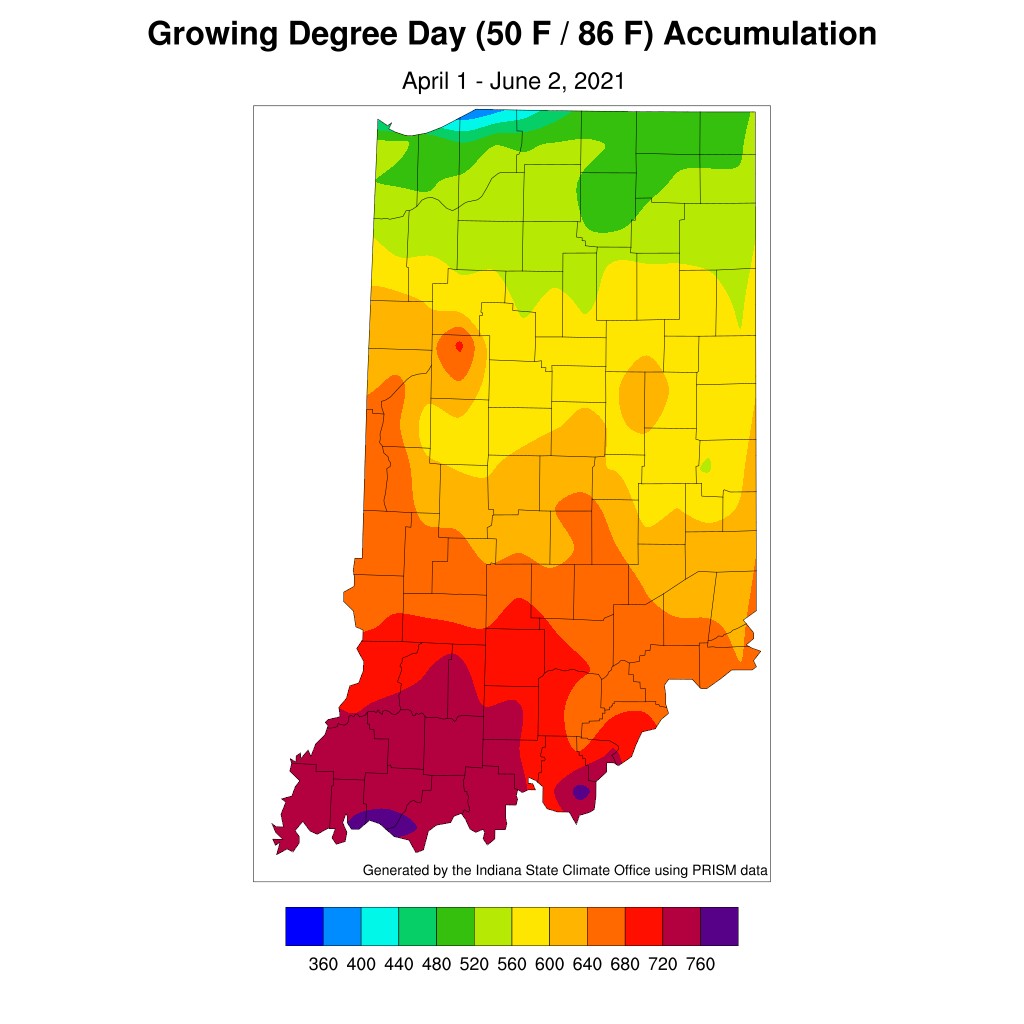
Modified growing degree-day (MGDD) accumulations since April 1 have started to catch up to near average for the 1991-2020 period. Northern counties are slightly ahead of normal MGDD accumulations and southern counties are still slightly behind normal (Figure 3). However, when compared to just the past 4 years, 2021 accumulations are still well behind what they were in 2017 and 2018 (Figure 4) across the state.
-
- Figure 1. The accumulated precipitation percentage of normals for May 2021.
-
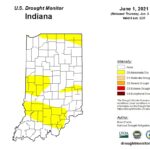
- Figure 2. The US Drought Monitor status for June 1, 2021.

-
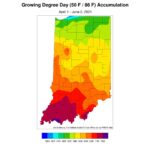
- Figure 3. Modified growing degree day accumulation from April 1 to June 2, 2021.
-
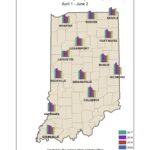
- Figure 4. Comparison of 2021 modified growing degree day accumulations from average for April 1 – June 2 to the past four years.