Aside from southern and far northern Indiana, the rest of the state has generally received below normal precipitation over the past 30 days (Figure 1). While only a few localized areas show percentages below the 30 percent-of-normal level (one of the factors considered to recommend the Abnormally Dry (D0) classification to the U.S. Drought Monitor authors), other factors are suggesting something may be developing. A challenge has been the very spotty nature of heavy precipitation events in the broad region that has caused localized flooded areas nearby areas that seem to keep missing out. The Indiana state drought monitoring team has also been looking at other factors such as evapotranspiration, soil moisture, stream and lake levels, and groundwater levels. Several of those factors did suggest the area was already abnormally dry so without significant additional precipitation most of Indiana is likely to enter the D0 category soon. Rumors will start to spread about a possible “flash drought” (i.e., a rapid intensification of drought). It is too soon to say if this will be imminent. To be strongly considered for this, a 2-category drop of the U.S. Drought Monitor should be justifiable over a two to three week period. Indiana currently only has a small area of D0 classification around the DeKalb County area (Figure 2), so conditions across Indiana would have to deteriorate quickly.
Unfortunately, the 7-day precipitation forecast as well as the 6-to-10-day and 8-to-14-day climate outlooks are not looking particularly wet. Figure 3 presents the amount of rain expected through July 30th with most of that falling in very localized areas sporatically over that period. Combine that with expected clear skies and high evapotranspiration rates and the moisture on the ground and within plants could be depleted quickly. Beyond a week, climate outlook models are slightly favoring below normal precipitation. This does not necessarily mean no precipitation, but how might this impact crops and other environmental conditions over the next several weeks?
Modified growing degree-day accumulations since April 15th continue to stay 1-3 days ahead of average (Figure 4) with totals ranging from YY to ZZ units (Figure 5).
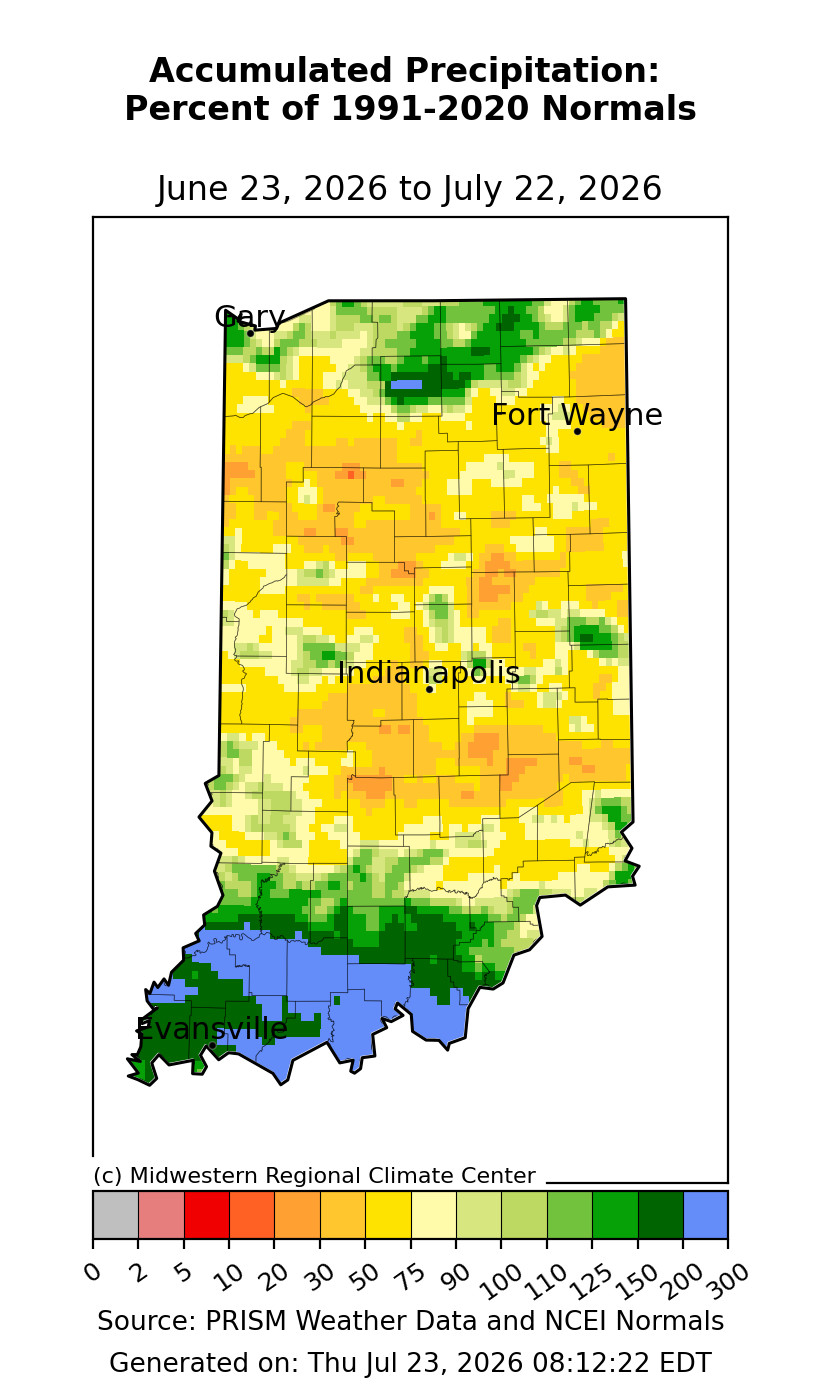
Figure 1. Accumulated precipitation from June 23 through July 22, 2026, represented as the percent of normal amounts that occurred during that same period from 1991-2020. A percent of normal value equal to 100 would indicate precipitation totals equal to that 30-year average.
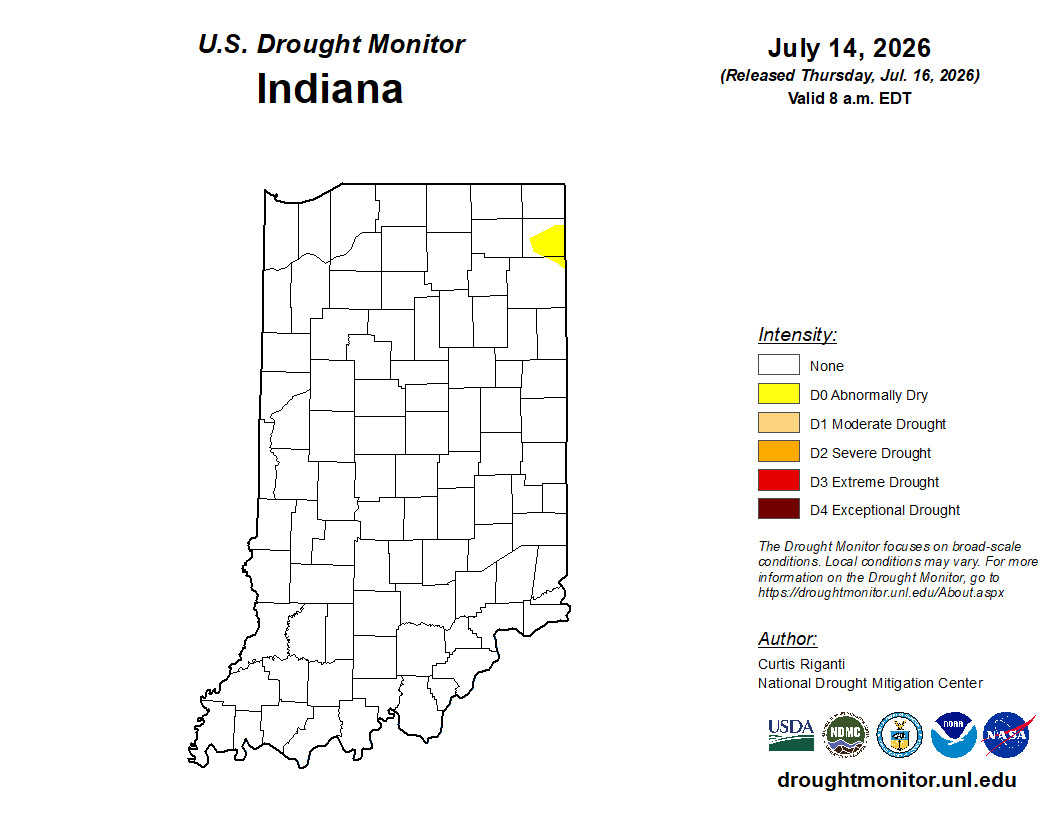
Figure 2. Drought status in Indiana according to the U.S. Drought Monitor that considered conditions through 8 AM EDT on July 14, 2026.
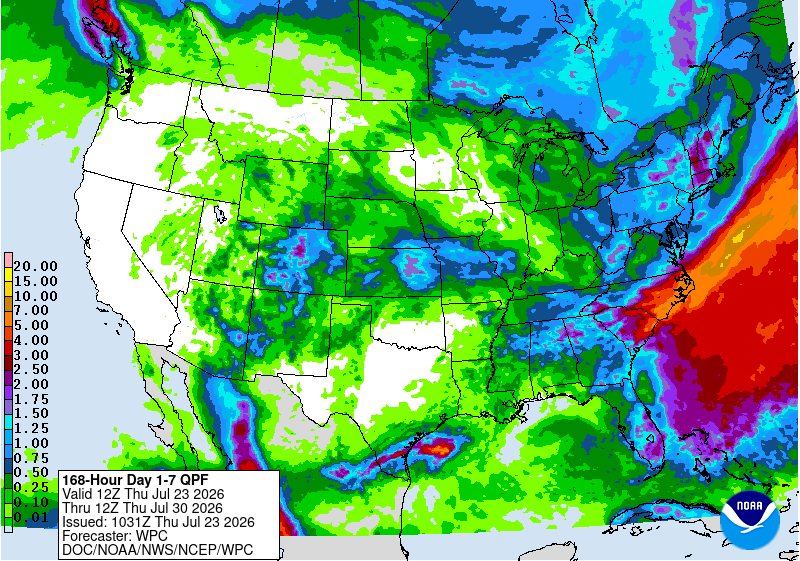
Figure 3. Seven-day precipitation accumulation (inches) for July 23-30, 2026.
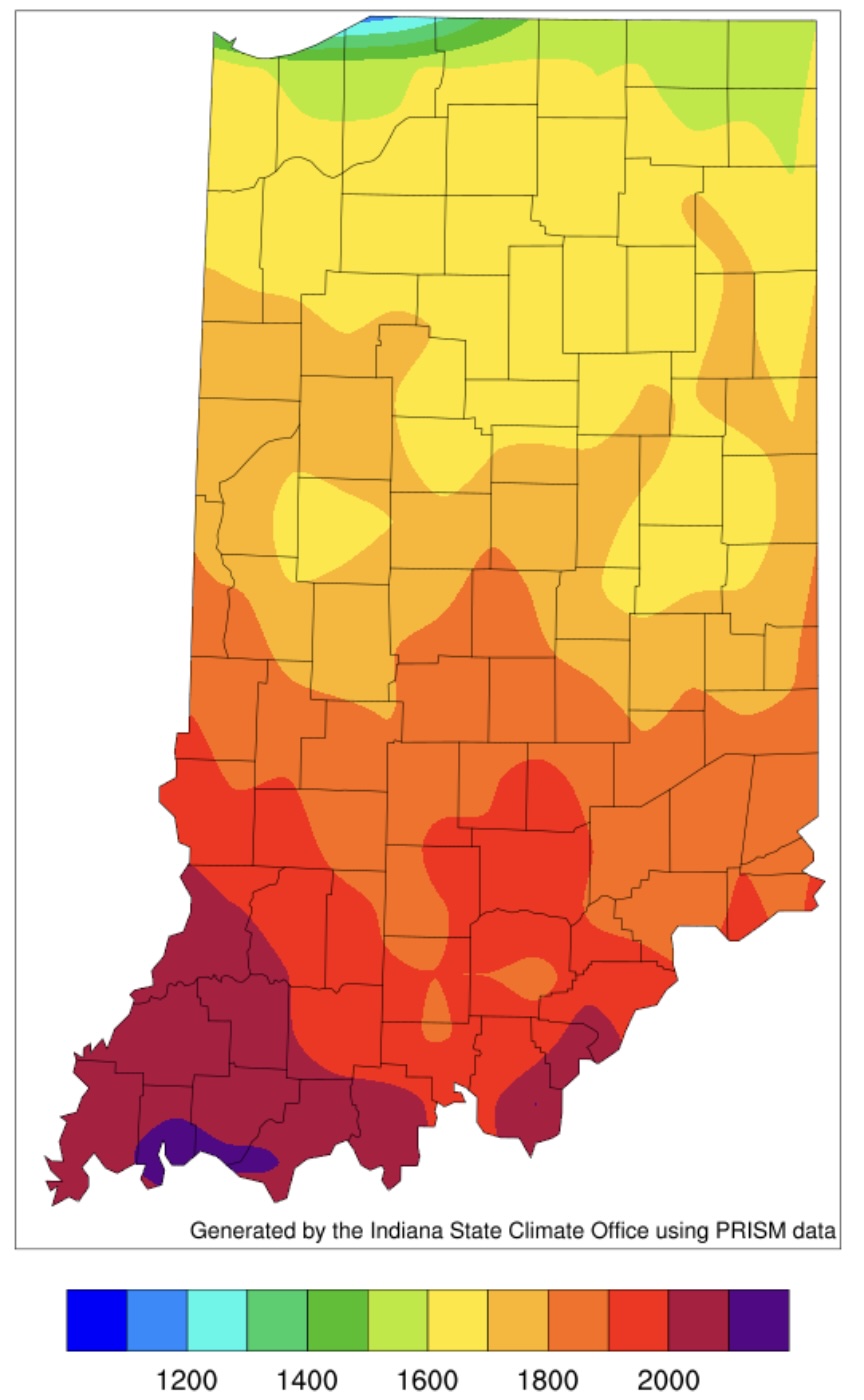
Figure 4. Modified growing degree-day (50°F / 86°F) accumulations from April 15 through July 21, 2026.
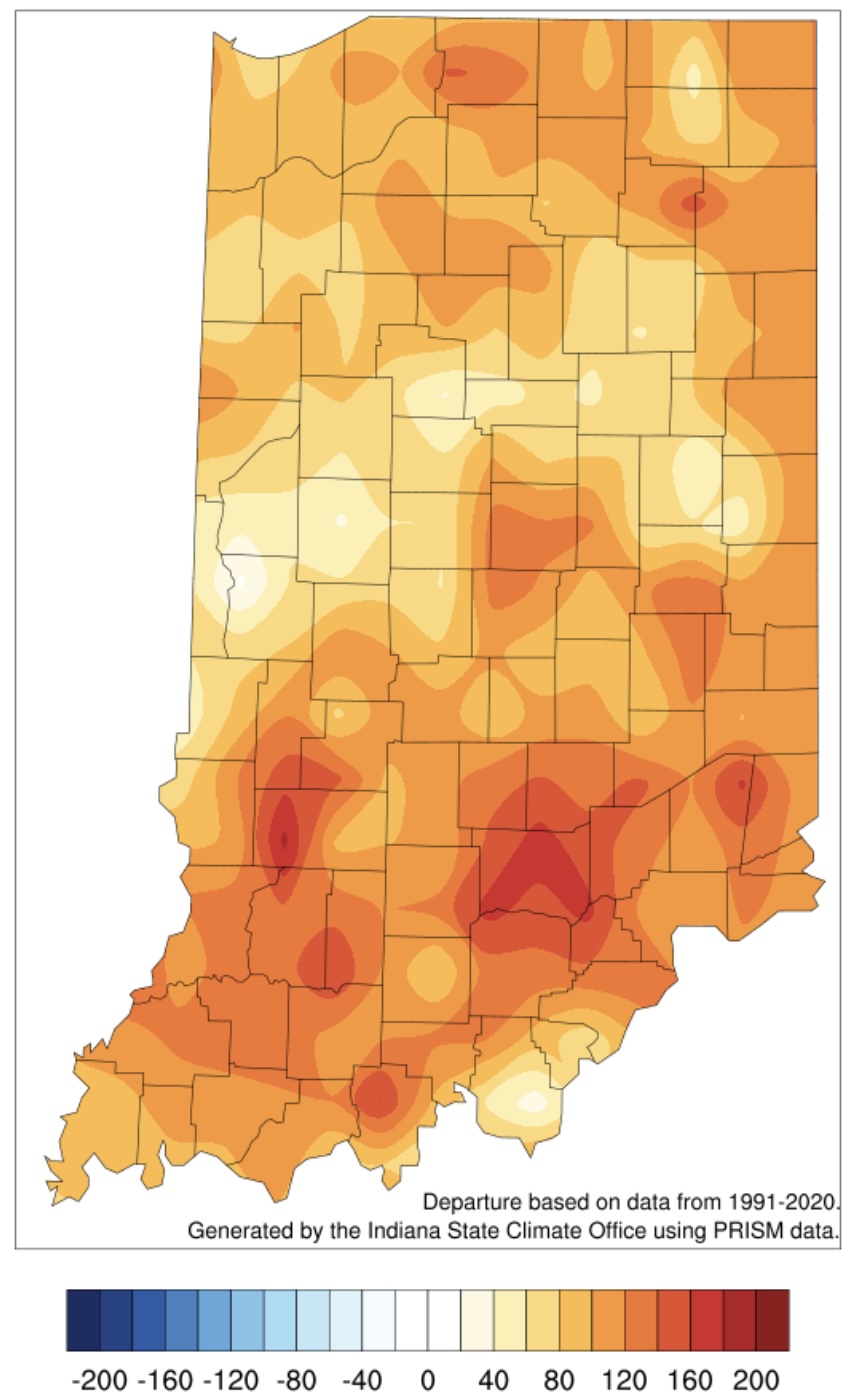
Figure 5. Modified growing degree-day (50°F / 86°F) departures from April 15 through July 21, 2026. For most Indiana locations, July daily accumulations are approximately 25 units. This can be used to estimate how many days ahead or behind average a location is from normal.