Indiana has already experienced several tornadoes this year with more certainly to come. Of course, this is not unusual since Indiana is often considered on the far northeastern edge of “Tornado Alley”. Tornadoes get their energy from the battle between the cooler, drier Canadian air moving southeastward and the warmer, more humid air coming north from the Gulf region. The greater the contrast in both temperature and humidity, the more likely winds and energy will be generated to develop those nasty weather events. This is why tornadoes are most common in our spring and in recent years autumn tornadoes have occurred with greater frequency.
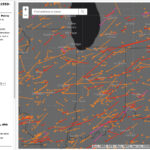
The Midwestern Regional Climate Center (MRCC) provides a Tornado Tracks Tool (https://mrcc.purdue.edu/gismaps/cntytorn) where users can view the estimated tracks of tornadoes from 1950 through 2023 (Figure 1). Official tornado data from the federal Storm Prediction Center (SPC) is released annually, and 2024 data should be released soon. The tool allows filtering by tornado magnitude, year range, months, and whether there were any documented injuries and/or fatalities. Clicking on a tornado provides further information. Do you remember a tornado from your past that you still tell stories about? Use that tool to explore what official records have to say about it!
The National Weather Service provide a nice tool for looking at the climatology of a broader range of events (e.g., tornadoes, hail, wind) (https://experience.arcgis.com/experience/170541dee33b48b7b88514b8f65e601f). Similar to the MRCC tool, this tool only has data through 2023.
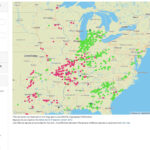
For more recent storm reports, the Southern Regional Climate Center (SRCC) provides an interactive tool similar to the MRCC Tornado Tracks tool but includes recent storm report data from the SPC (Figure 2). This tool includes a much broader range of storm types such as drought, flood, fire, hail, hurricanes, thunderstorms, and tornadoes. Users can select a period, zoom into their area of interest, and select which types of storm events to view. A table below the map provides additional information about each event.
Extreme weather events are nothing to take lightly, and safety should always be the priority during the event. However, once the event has passed and it can be shared as an memory or anecdote, using these tools can be a fun way to see how your event stacks up to other events nearby.
- Figure 1. Snapshot of the MRCC’s Tornado Tracks tool depicting tornadoes greater than or equal to an EF3 on the enhanced Fujita scale from 1950 through 2023.
- Figure 2. Snapshot of the SRCC storm reports tool showing hail (red), tornado (blue), and strong wind (green) reports from March 28 through April 1, 2025.

